How to use the CROssBAR Web-service?
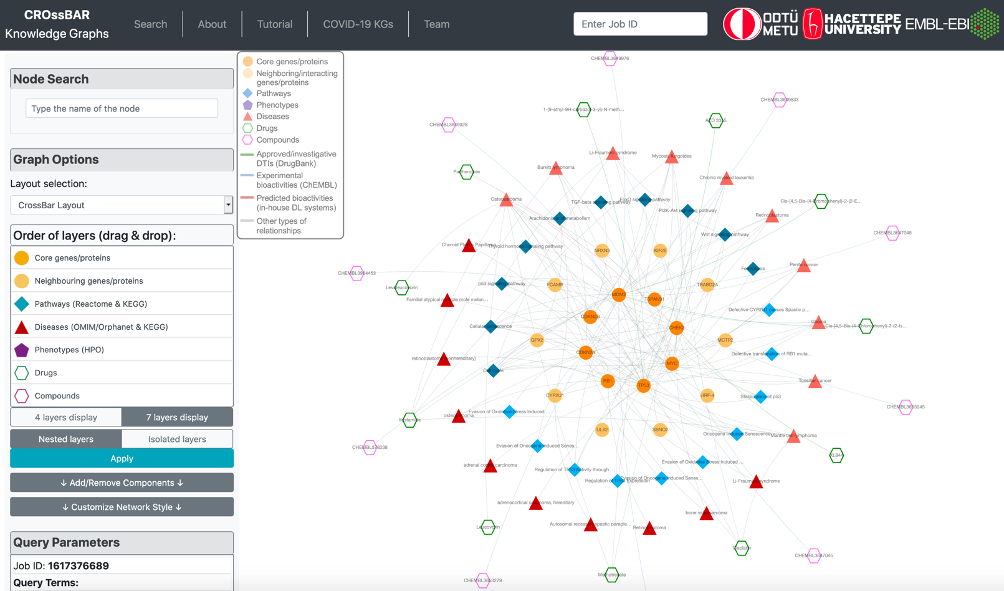
CROssBAR web-service is especially designed to provide an easy-to-use interface to the researchers from different fields of molecular life sciences. The horizontal menu at the top has links to provide information about the service, knowledge graphs and about the project in general. The menu also includes example use-cases of COVID-19 knowledge graphs. Home/search button at the left-most side of the menu displays the main page for constructing user queries.

At the main pane, there is a vertical query menu at the left side of the page. On the right side, there is a blank/white area to house the knowledge graph once it is constructed.
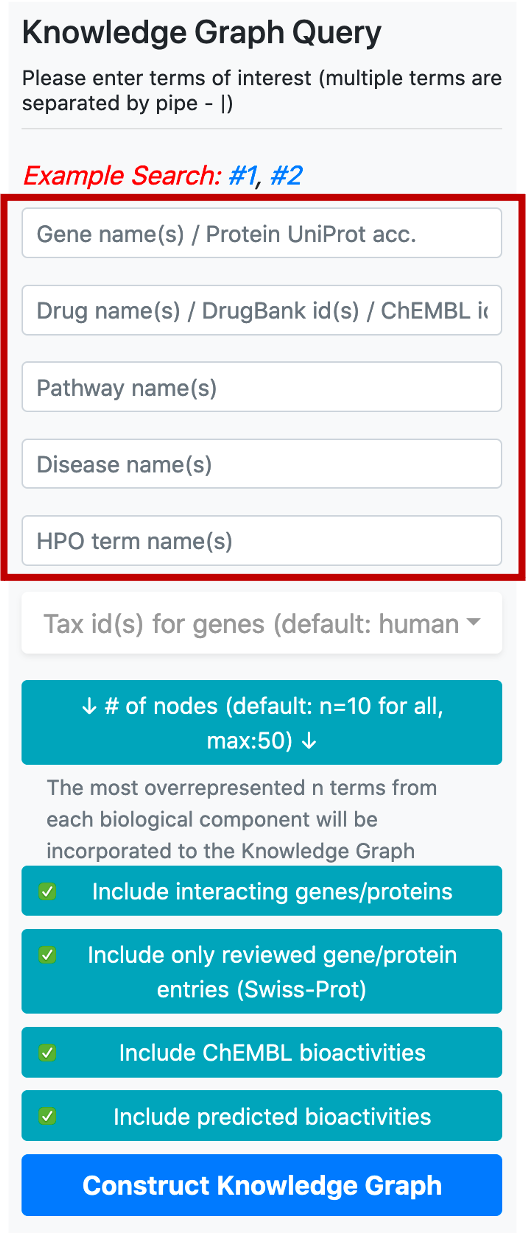
The user may construct complex queries by simply entering the biological entities she/he is interested in by typing the names/ids in their respective boxes, located inside the vertical query menu.
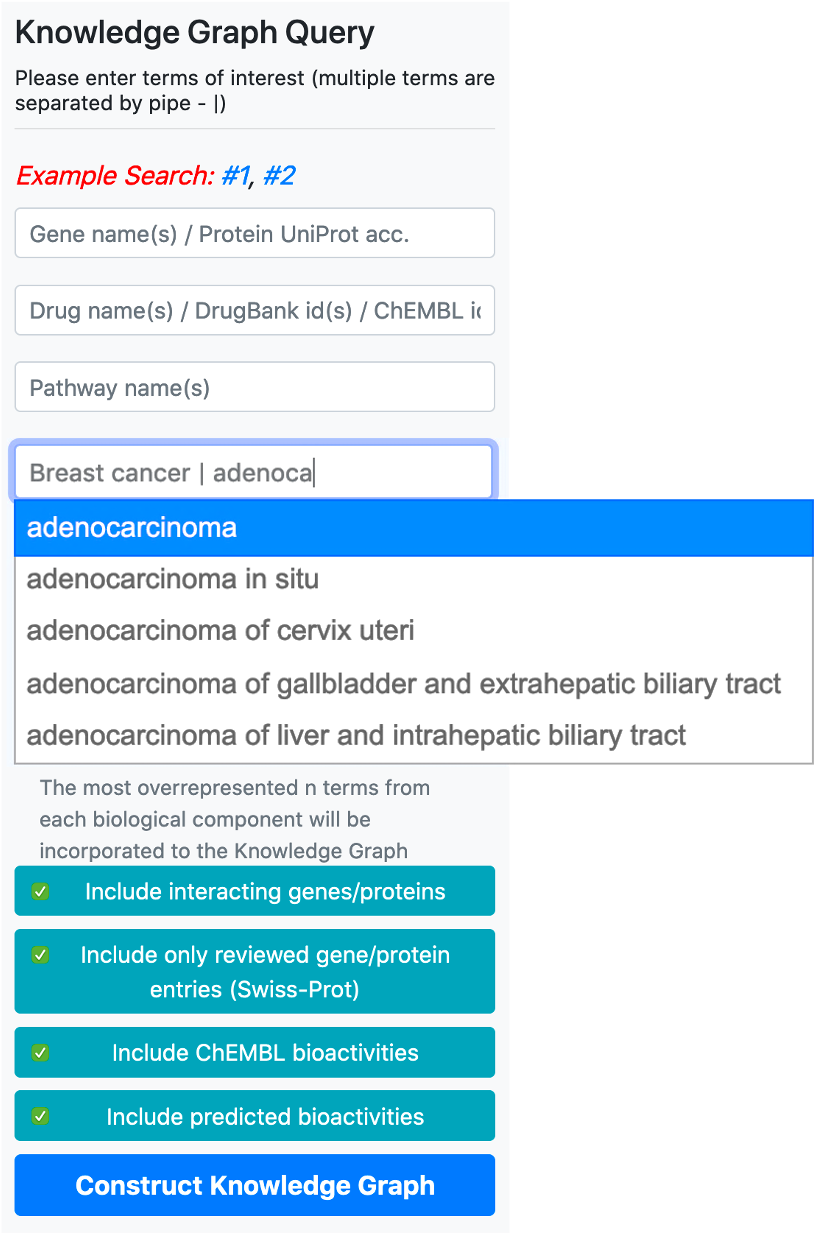
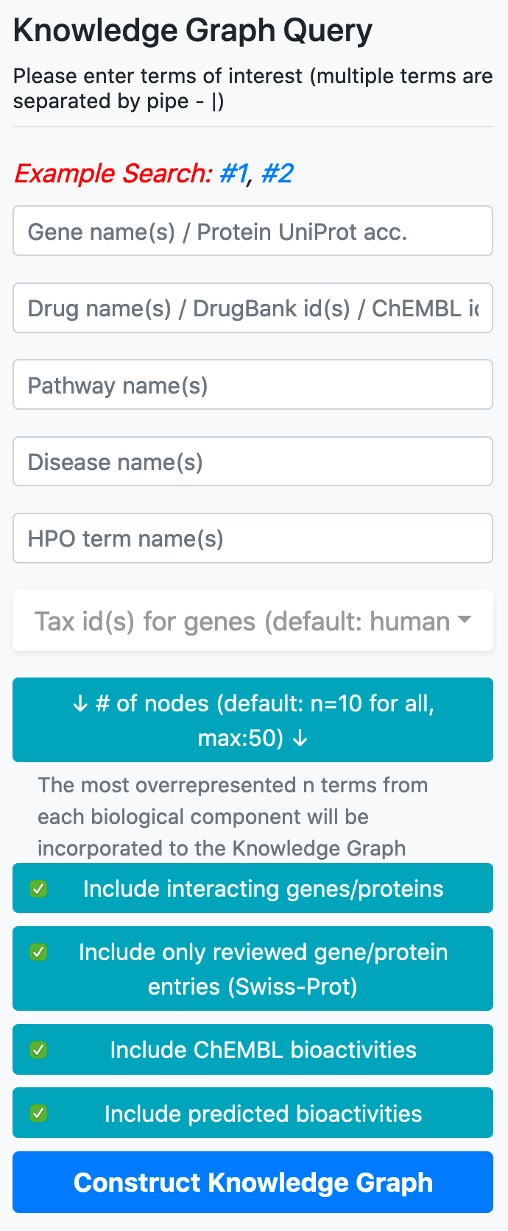
There are 5 boxes reserved for writing the names or ids of genes/proteins, drugs/compounds, pathways, diseases, and phenotype terms, respectively. After typing a few letters, the system suggests terms that exist in the database, which match the typed letters. The user should select a term from this list. Following the selection of a term from the provided list, additional terms can be appended to the same box by continuing to type another name/id. There are no automated suggestions for identifiers (e.g., UniProt accessions: "P60484", DrugBank ids: "DB01611" and ChEMBL ids: "CHEMBL123456").
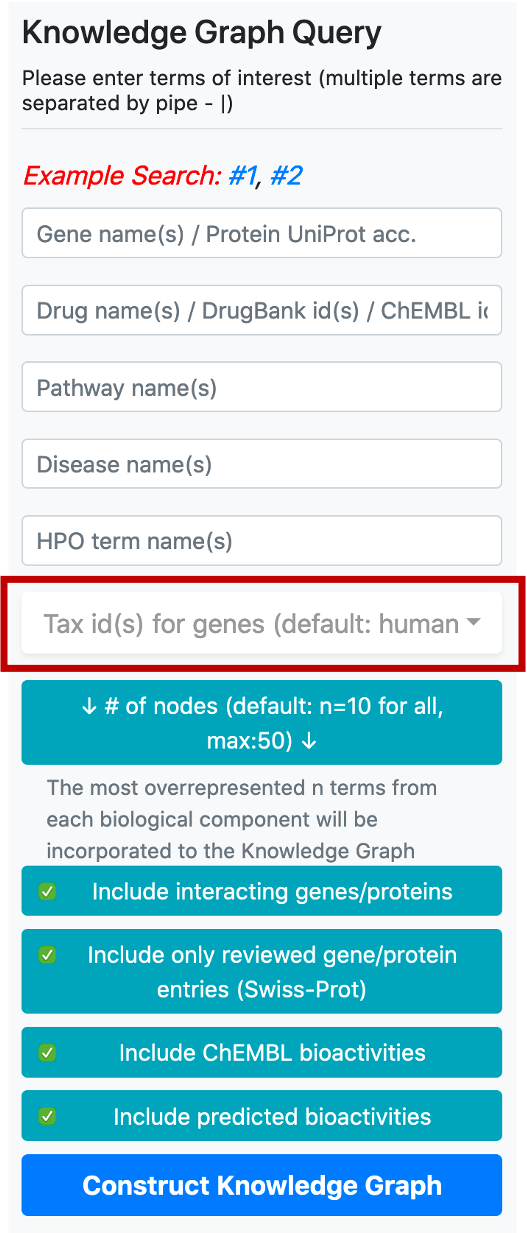
Taxonomic id filter box is located below the term search boxes. The default value for the taxonomic filter is 9606 (human), since the main focus of CROssBAR is biomedicine. This filter is mainly used to include the genes/proteins of non-human organisms into the query, together with their respective relations. It is possible use the taxonomic filter to include genes/proteins from a few additional (mostly model) organisms namely, Rattus norvegicus (Rat) [10116], Mus musculus (Mouse) [10090], Sus scrofa (Pig) [9823], Bos taurus (Bovine) [9913], Oryctolagus cuniculus (Rabbit) [9986], Saccharomyces cerevisiae (Baker's yeast) [559292], Mycobacterium tuberculosis [83332], Escherichia coli - strain K12 [83333], Severe acute respiratory syndrome coronavirus (SARS-CoV) [694009], Severe acute respiratory syndrome coronavirus 2 (2019-nCoV) (SARS-CoV-2) [2697049]. It is possible to include multiple organisms in the query by checking their tax ids in the respective box.
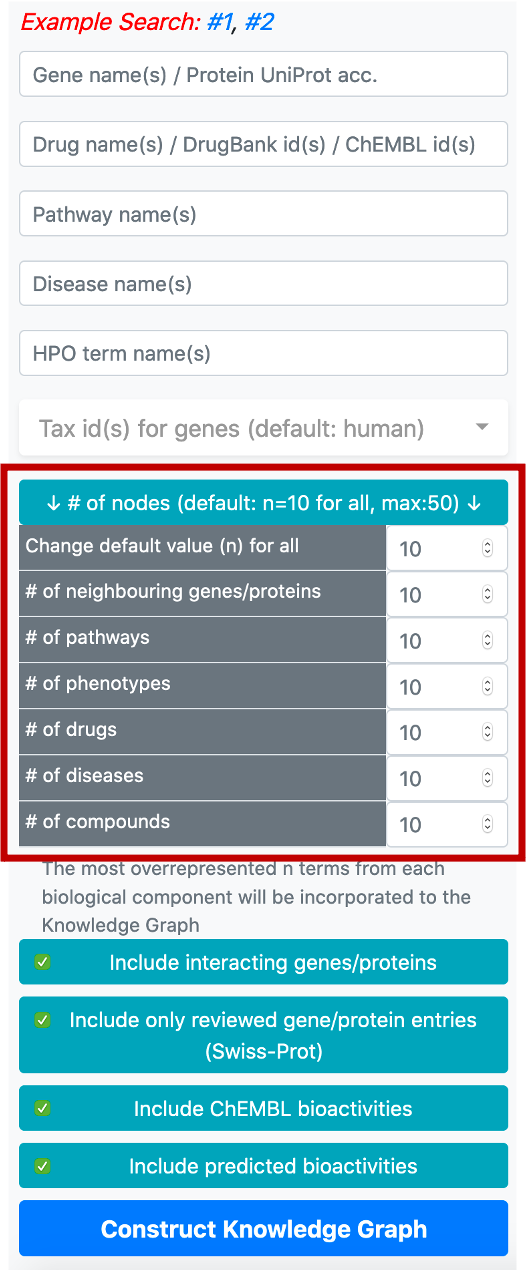
The button located below the taxonomy filter is used to enter the number of nodes to be included in the graph following the enrichment/overrepresentation analysis. For each biomedical entity type (e.g., disease, phenotype, drug, compound, pathway, gene/protein) terms that are related to genes/proteins in the knowledge graph are ranked starting from the most overrepresented/enriched one. The default value for the number of nodes is 10 (for each biological component), which means that the top 10 overrepresented pathways, diseases, phenotypes, drugs, compounds and interacting/neighbouring genes/proteins entries will be included into the knowledge graph. It is possible to change this value by clicking the respective button, which opens a box containing the names of biological components to set a distinct number for each.
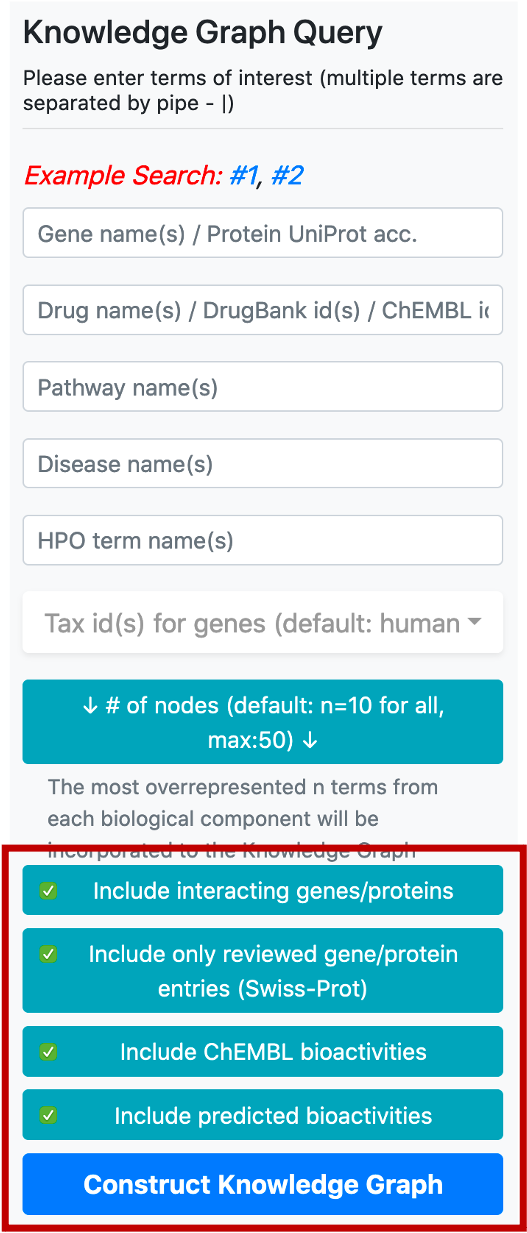
Following that, there are four buttons, first one to include or exclude the proteins that are directly interacting with the collected core proteins (based on PPI data), into the graph. Interacting proteins are included in the default version. The second one is used to filter out the unreviewed gene/protein entries (i.e., UniProtKB/TrEMBL database entries) from the knowledge graphs, to avoid redundancy. The default selection here is only to include reviewed gene/protein entries. The third button is to include/exclude bioactivity relationships between drugs/compounds and target proteins from the ChEMBL database. The fourth button is to include/exclude bioactivity relationships predicted by our in-house deep learning-based prediction systems.
Following the entering of desired input terms and parameters, you are required to click the last button at the bottom of the menu, “Construct Knowledge Graph”, which initiates the automated knowledge graph construction process.
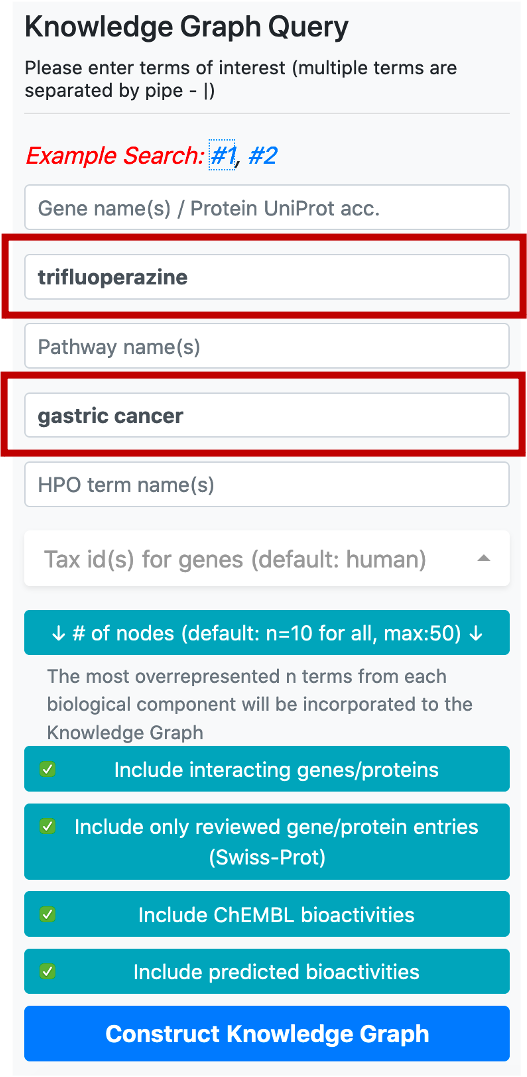
An Example CROssBAR Query:
In this example, we would like to observe the relations between a disease (gastric cancer) and a drug (trifluoperazine) which is an approved antipsychotic agent mainly used in the treatment of schizophrenia. Trifluoperazine has no in vitro, in vivo or clinical studies concerning the treatment of gastric cancer. Thus, this is a convenient scenario for observing unknown relationship between 2 biological entities, gastric cancer and trifluoperazine. This is also the example search #1 in our web-service.
The output knowledge-graph is given in the two figures below. Query nodes and their edges are highlighted by default in the graph. The user may un-highlight all the nodes and edges by left-clicking on an empty space on the graph area. It is possible to highlight any node and its respective edges by left-clicking on the node of interest. It is also possible to highlight edges by clicking, as well.
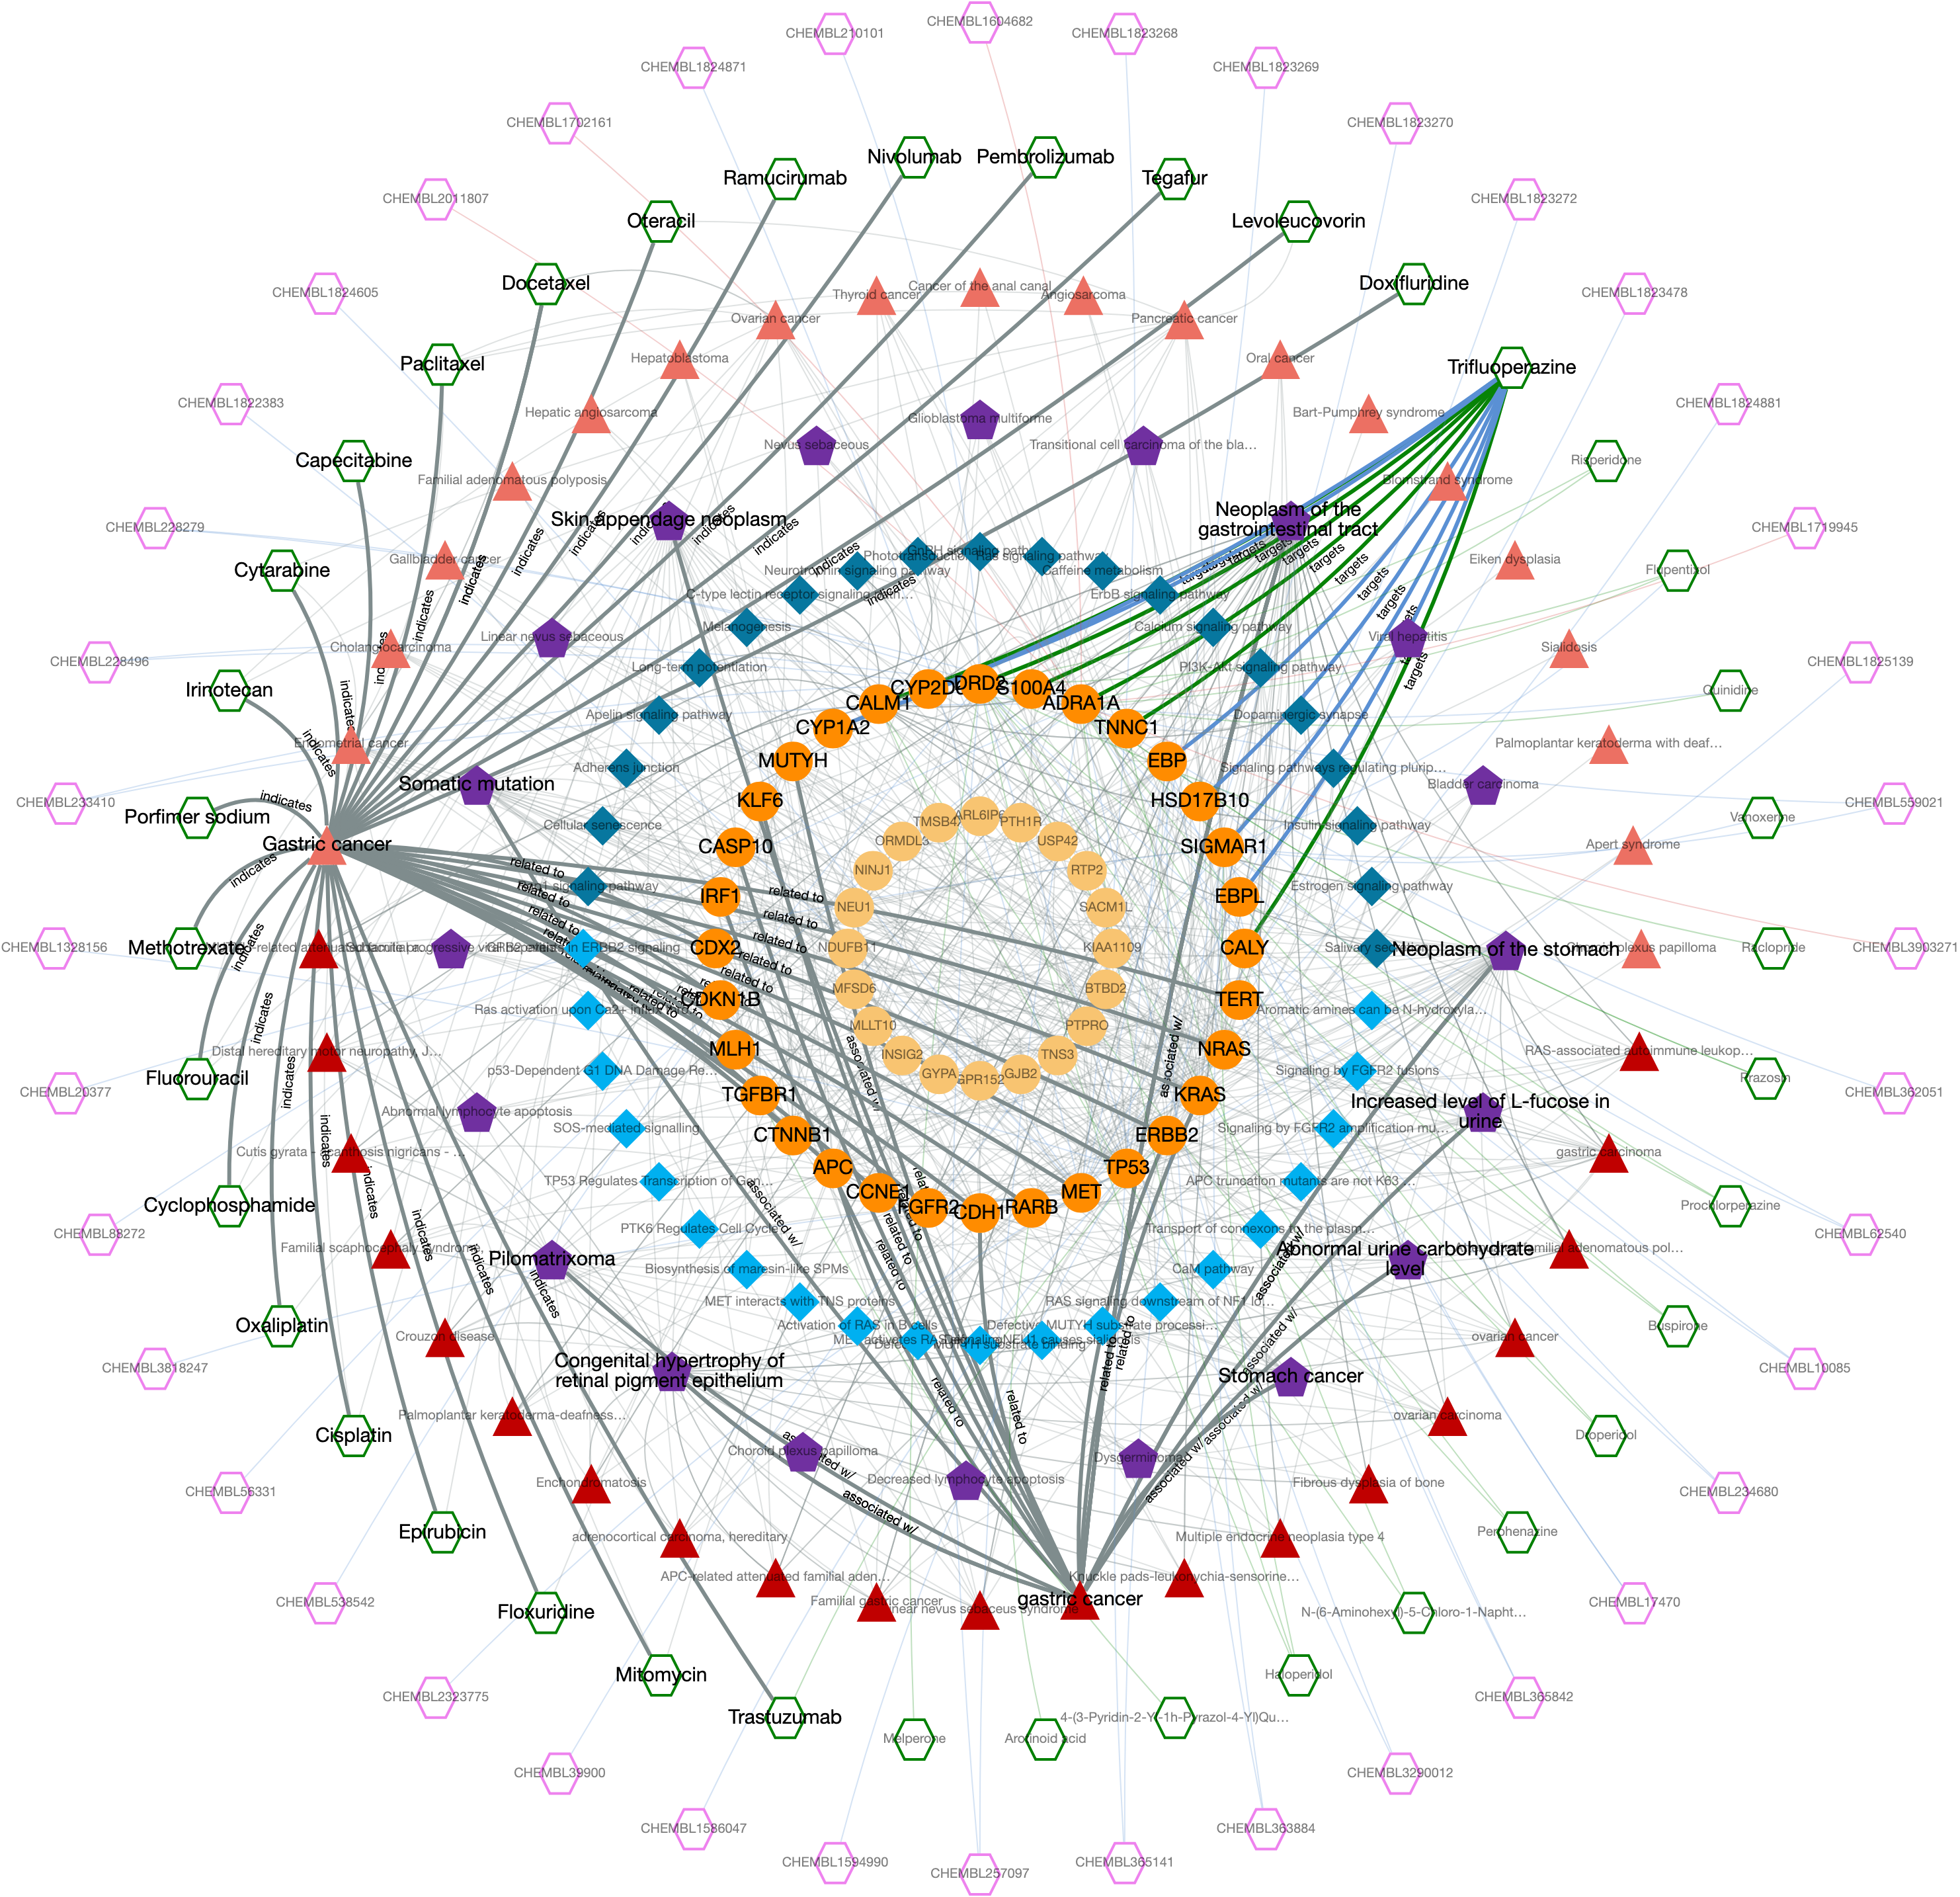
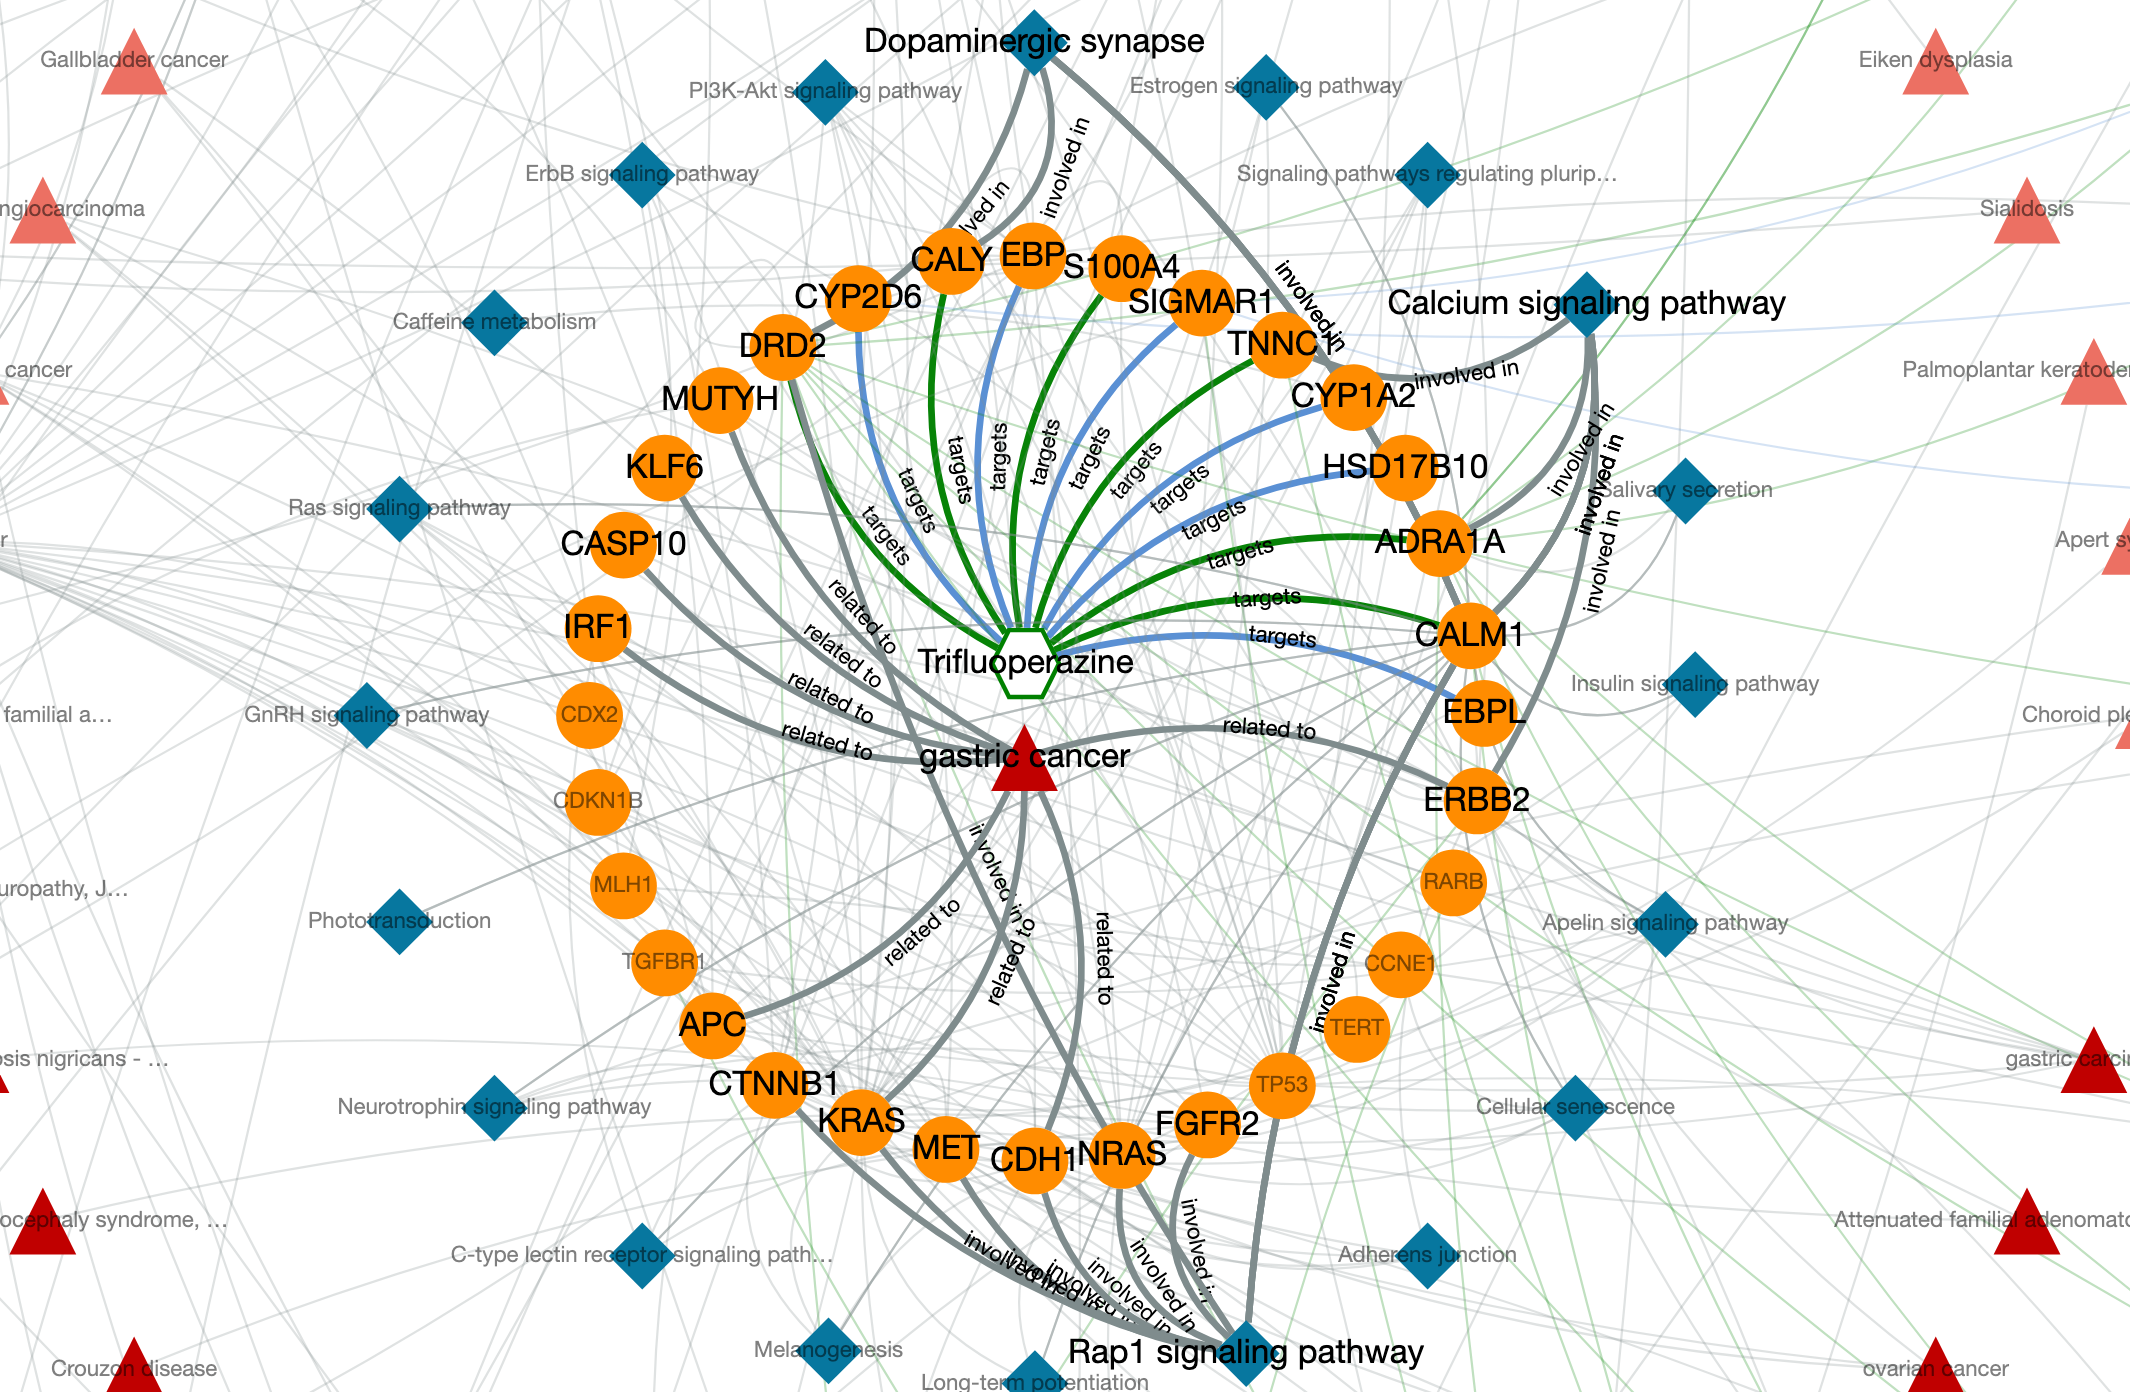
Trifluoperazine shows its antipsychotic effect by the blockage of dopamine D2 receptor. This relation also appears in the graph, where trifluoperazine binds to DRD2 gene/protein node and it is associated with the dopaminergic synapse pathway. In the KG, trifluoperazine also has other approved targets such as CALM1, ADRA1A and TNNC1 proteins (approved drug-target interaction edges are coloured in green), and these proteins are associated with calcium signalling pathway. Moreover, DRD2 and CALM1 are associated with rap1 signalling pathway. Both calcium and rap1 signalling pathways have other gene/protein associations such as ERBB2, KRAS, and CDH1, which are associated with the gastric cancer disease. Therefore, trifluoperazine can be explored further in terms of its potential to become a repurposed agent for the treatment of gastric cancer, which may show its activity via calcium and rap1 signalling pathways. More information about this example is provided in our paper.
Visualization Options
At the results screen, there is a multi-functional menu at the left side of the window, whereas, knowledge graphs are displayed on the right side.
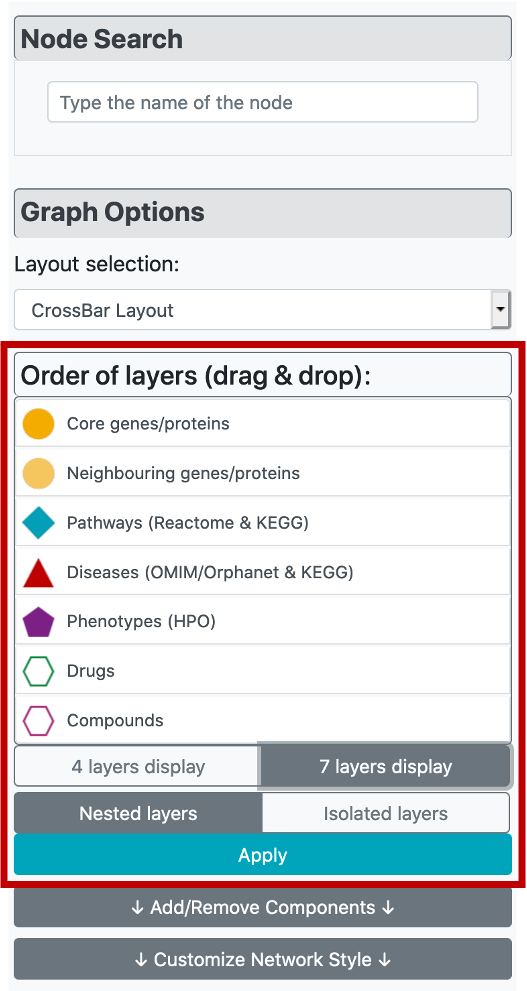
Considering the visual customization of the constructed graph, it is possible to apply different layout options from "Layout selection" part under "Graph Customization" menu, on the left side of the page. The user has 5 different layout options, which are the CROssBAR layout (two versions where the layers are either nested or isolated), circle, grid, cose, and concentric.
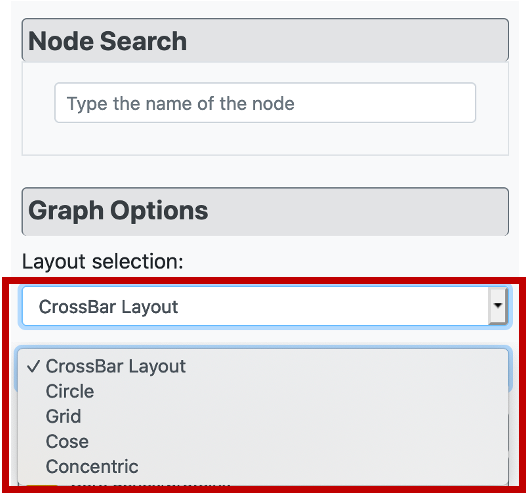
There are two versions of the CROssBAR layout, nested layers (default) and isolated layers. In the isolated version, each layer is circularized independently, whereas in the nested version, layers are intertwined. With the aim of preventing overlapping nodes, the radius of each circle is selected as a different value in the nested version.
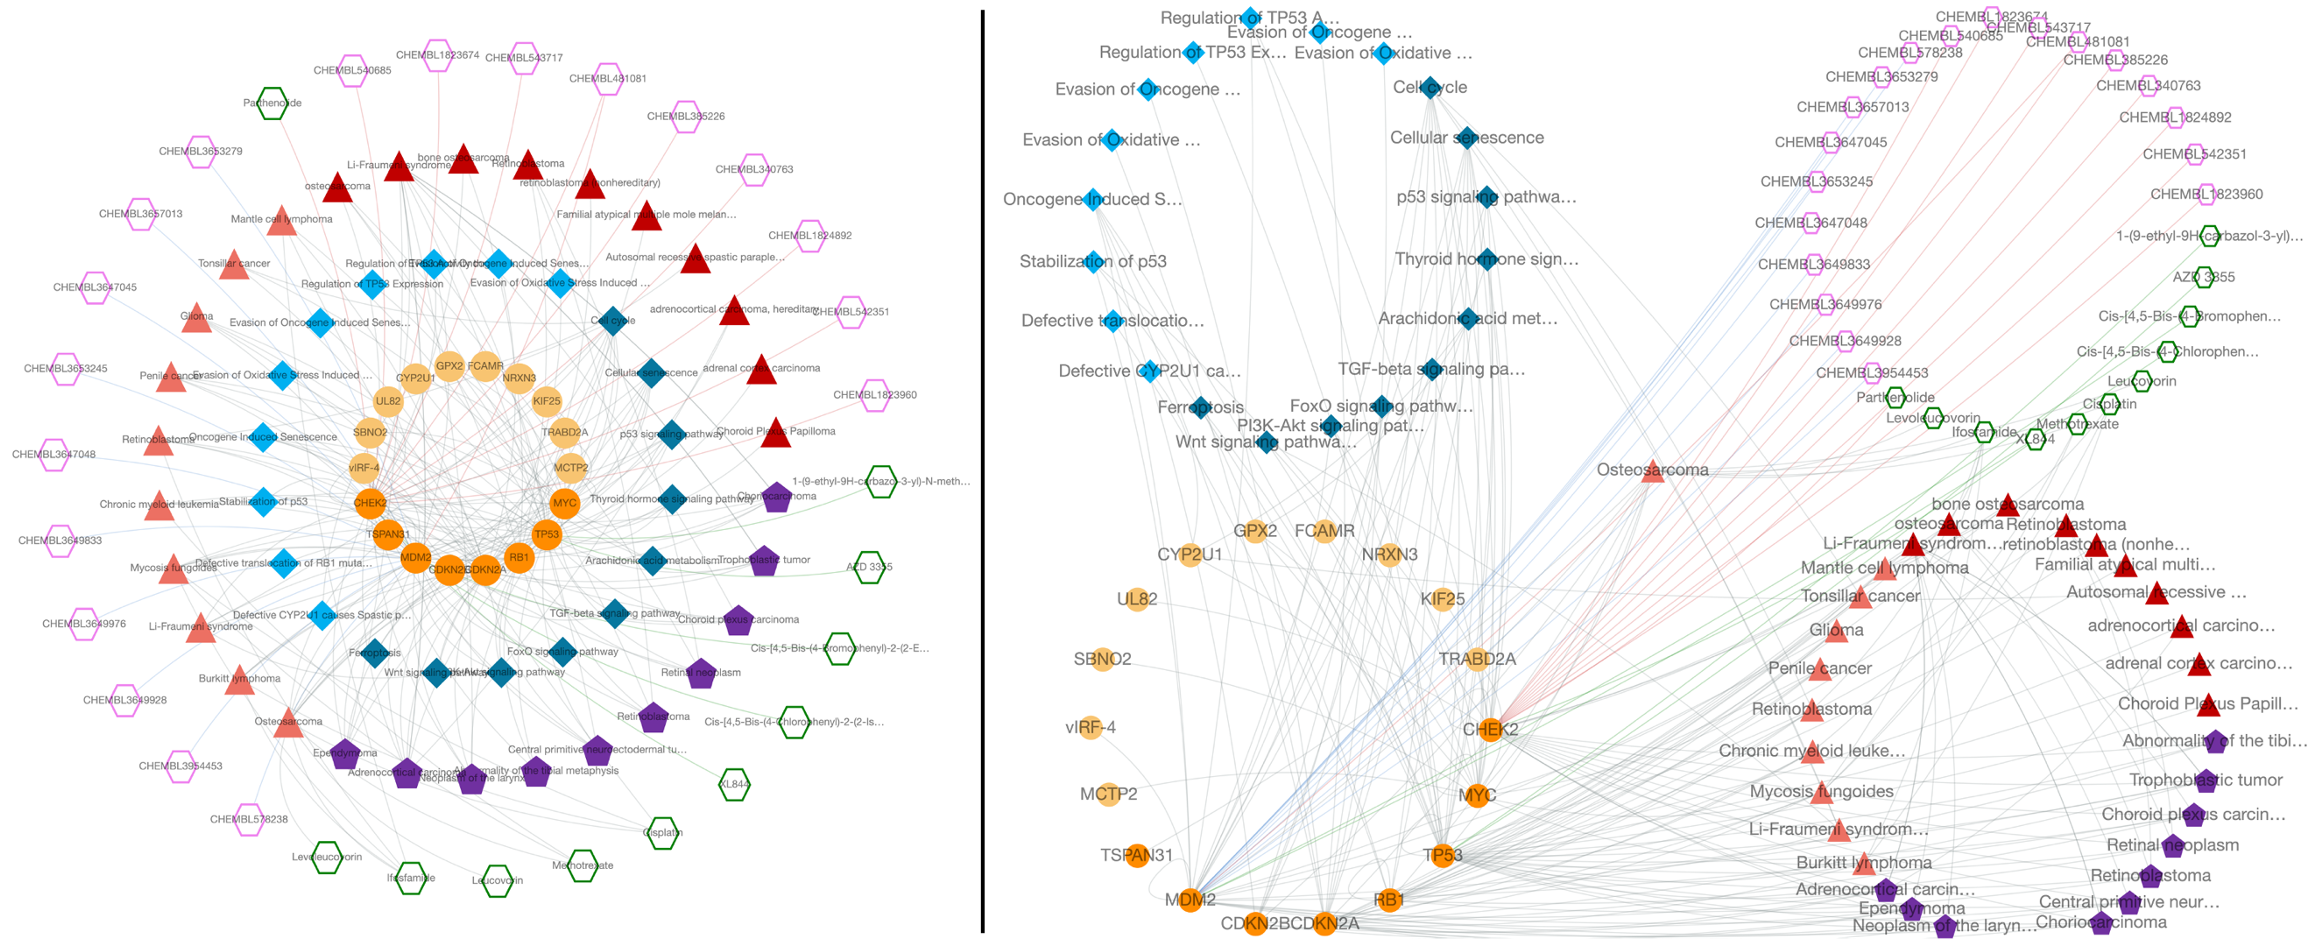
Both versions come with 4-layer and 7-layer (default) display options, which can be selected by the user solely based on visual preference. Biologically similar components are merged under one layer in the 4-layer display. Also, the order of layers can be changed (the ranking is from inside to out) by dragging node types in "Order of layers (drag & drop)" part of the menu. After clicking the "Apply" button, the changes are displayed on the graph.
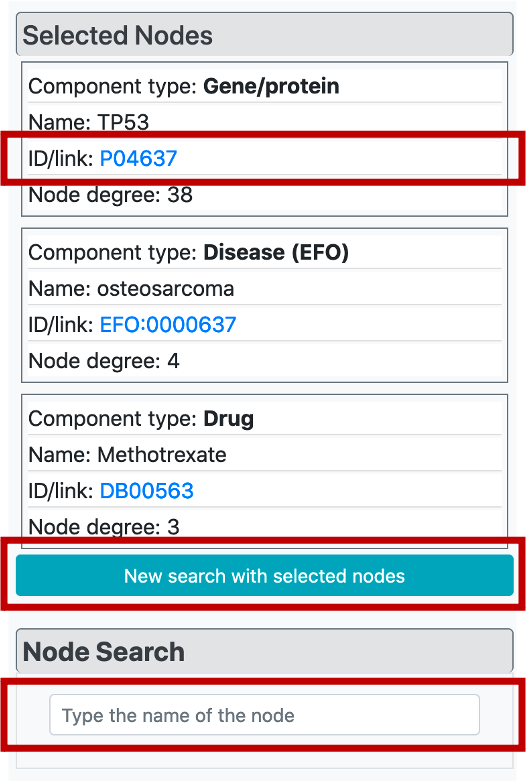
If the user clicks any node on the graph, "Selected Nodes" menu will appear at the top of the "Graph Customization" menu and it brings specific information for these nodes/terms, including the component type, name, id/link, and the node degree. It is also possible to click ids of these terms which opens the corresponding terms page on the dedicated biological database.
It is possible to easily build a new CROssBAR KG by taking the currently selected/highlighted nodes as the query terms easily by clicking the button below node tables. This way, it is possible to explore biological/biomedical subjects iteratively by changing/modifying the terms of interest.
In the node search menu, it is possible to easily find and highlight a term that is in the current KG by typing its name and selecting from the list of suggestions.
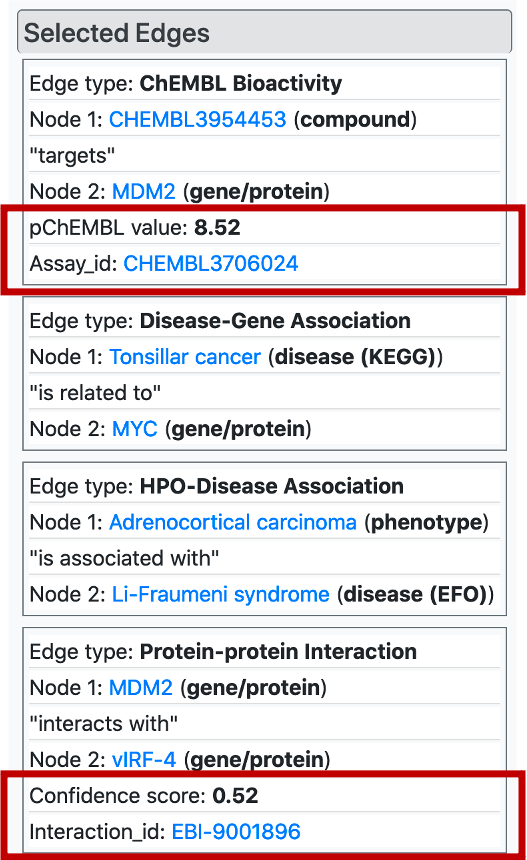
Similar to nodes, it is possible to select/highlight edge by clicking on them on the KG, which displays the edge tables on the "Selected Edges" menu. Here, drug/compound – target protein interactions and protein-protein interactions are displayed with quantitative values that serve as a strength or reliability of the relationship. Also, we provide links to the dedicated databases (within bioassay and interaction ids) where the user may obtain more information regarding the relationship.
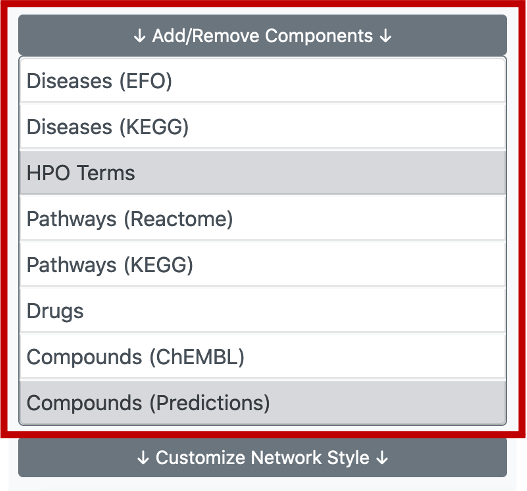
The user can click on the "Add/remove Components" button, a part of the "Graph Options" menu, which will bring a list of node types (biological components) in the graph including diseases, HPO terms, pathways, drugs and compounds (experimental bioactivities as ChEMBL and predictions). Then, the user can hide the nodes from the graph by clicking unwanted node types on the list.
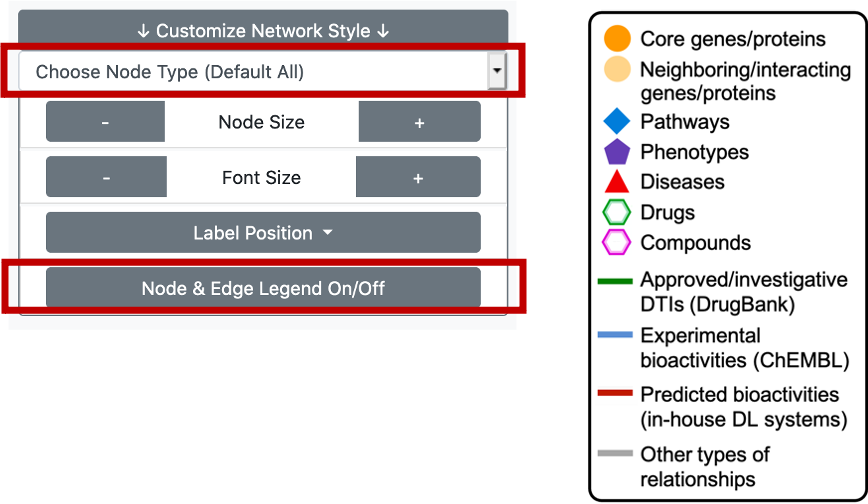
The user can click on the "Customize Network Style" button, another part of the "Graph Options" menu, which will bring a list of options such as setting the node size, node label font size and the position of the node labels. It is both possible to change these values for all types of terms/nodes in the graph, or by electing a specific node/term type and changing only its values.
We also provide a node & edge legend in the KG area, to provide information regarding the meanings of colours and shapes on the graph. It is possible to shut this legend down by clicking the button at the bottom of the "Customize Network Style" drop down box.
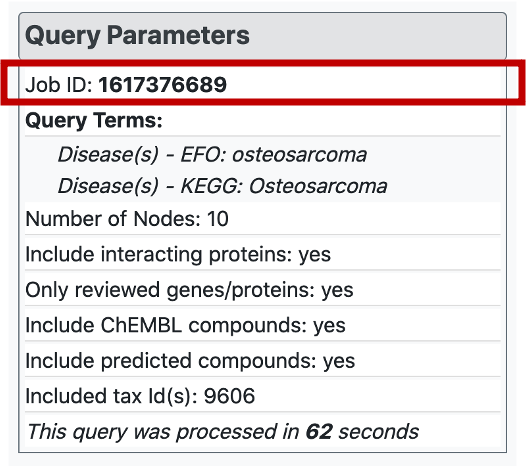
There is a "Query Parameters" menu, inside which the meta data regarding the search is provided. Here, the job id of the query is available, together with the names or ids of the search terms, selected parameters and the query runtime. Each job is saved on the web-server for a limited amount of time. Therefore, it is possible to access the constructed graph later by entering corresponding job id into "Enter Job ID" box on the horizontal menu at the top of the page.

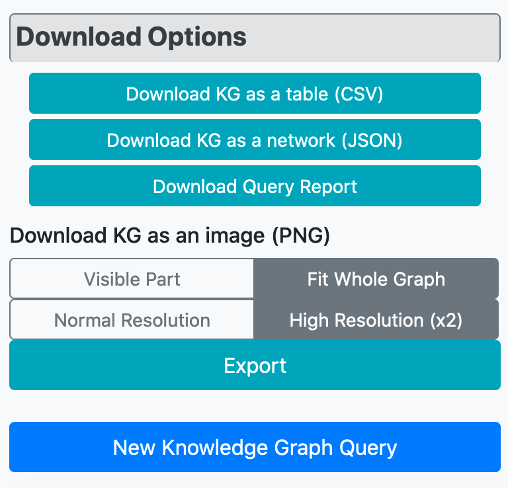
There are different download options to save the graph output. The user can download the constructed KG as a protein-centric table in "csv" file format, which includes proteins in the first column and their interacting biological entities in the remaining columns. The KG can be also downloaded as a network in json format. To see the construction steps of the KG and the enrichment scores and p-values of the nodes in the graph, a downloadable query report is also available. As the final download option, the user can export the KG as an image in "png" format, as well. The image can either be exported in terms of the part visible on the screen, or as the whole network, with normal and high-resolution download options.
At the bottom of the vertical menu on the left side of the page, there is a final button named “New Knowledge Graph Query” to allow a new search by going back to the initial search page.