CROssBAR Knowledge Graphs
(Detailed information can be obtained from CROssBAR article) The term knowledge graph defines a specialized data representation approach, in which collections of entities are linked to each other in a semantic context. In CROssBAR knowledge graphs, biological entities/terms are represented as vertices/nodes. Distinct types of nodes are defined for:
- biomolecules (i.e., genes and proteins),
- biological mechanisms (i.e., processes/pathways),
- pathologies (i.e., diseases),
- phenotypes (i.e., abnormalities, symptoms, etc.), and
- molecules used for treatment (i.e., drugs and drug candidate compounds).
Relationships between same and different types of biological entities are expressed by the edges of the graph. Types of edges vary according to the defined relationship. The edge label for a relationship between:
- two proteins: "interacts with",
- a gene/protein and a disease: "is raleted to",
- a drug/compound and a protein: "targets",
- a gene/protein and a pathway: "is involved in",
- a gene/protein and a phenotype term:"is associated with",
- a drug and a disease: "indicates",
- a disease and a pathway: "modulates", and
- a disease and a phenotype term: "is associated with".
An Example CROssBAR Knowledge Graph
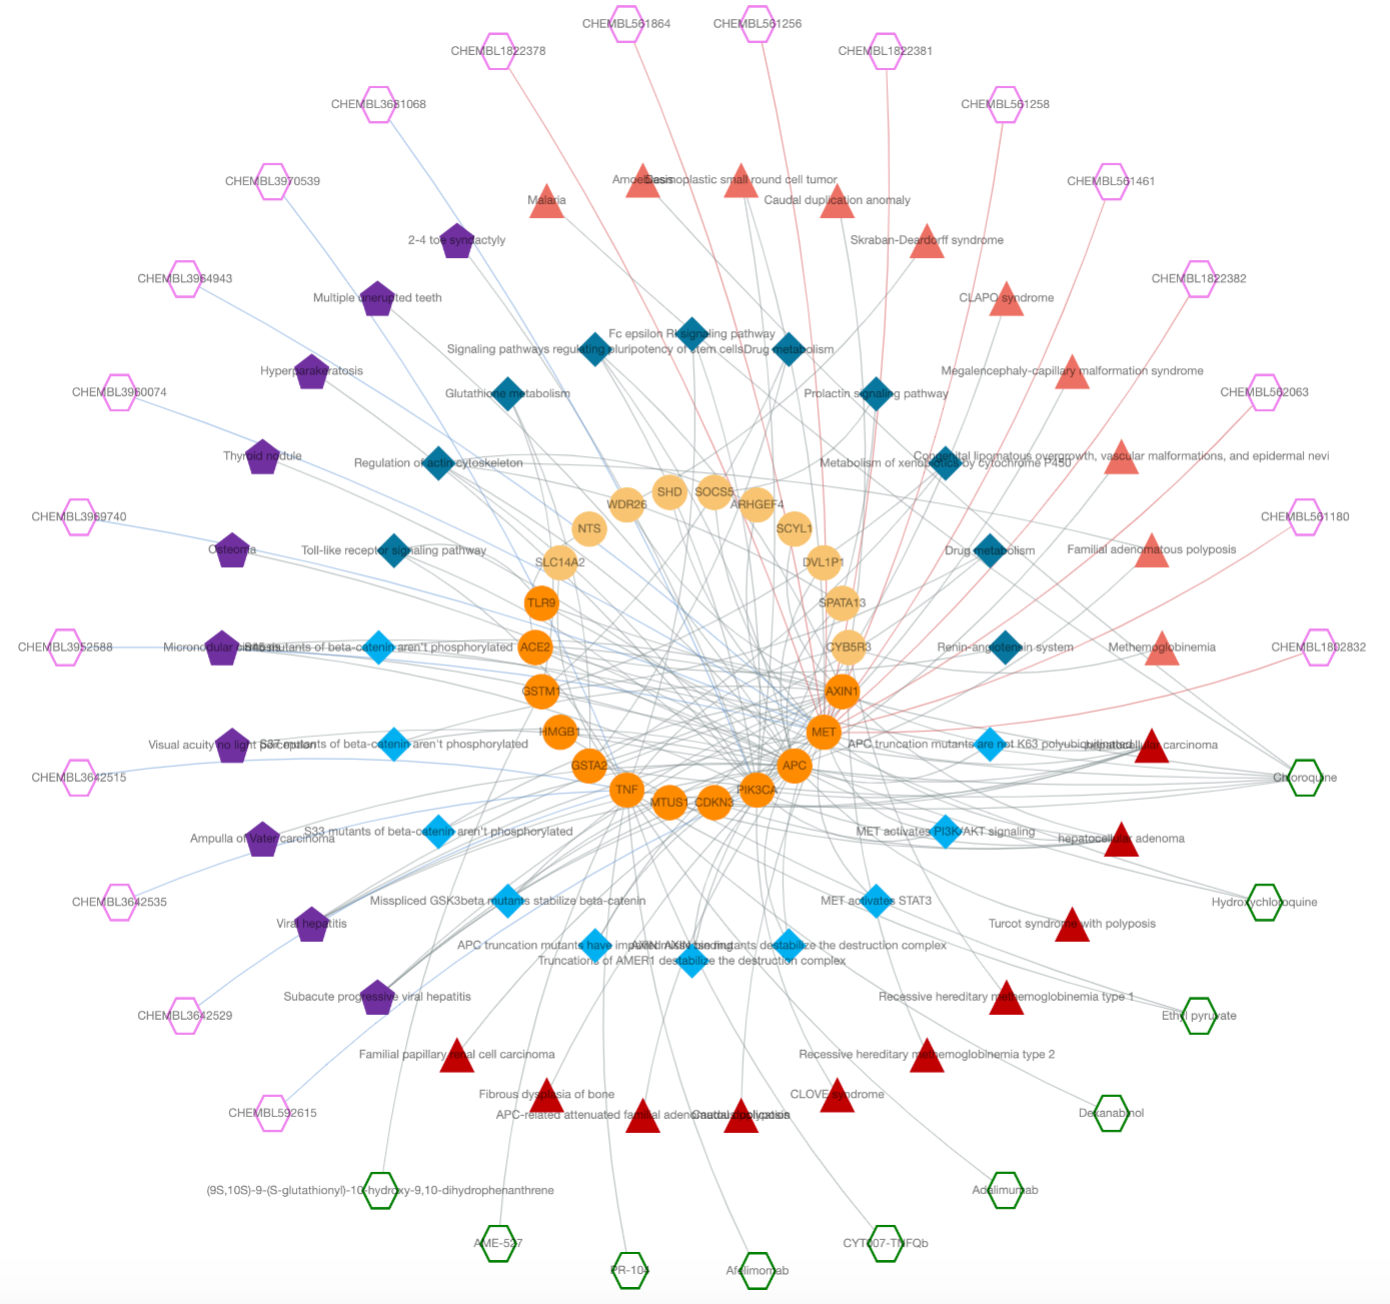
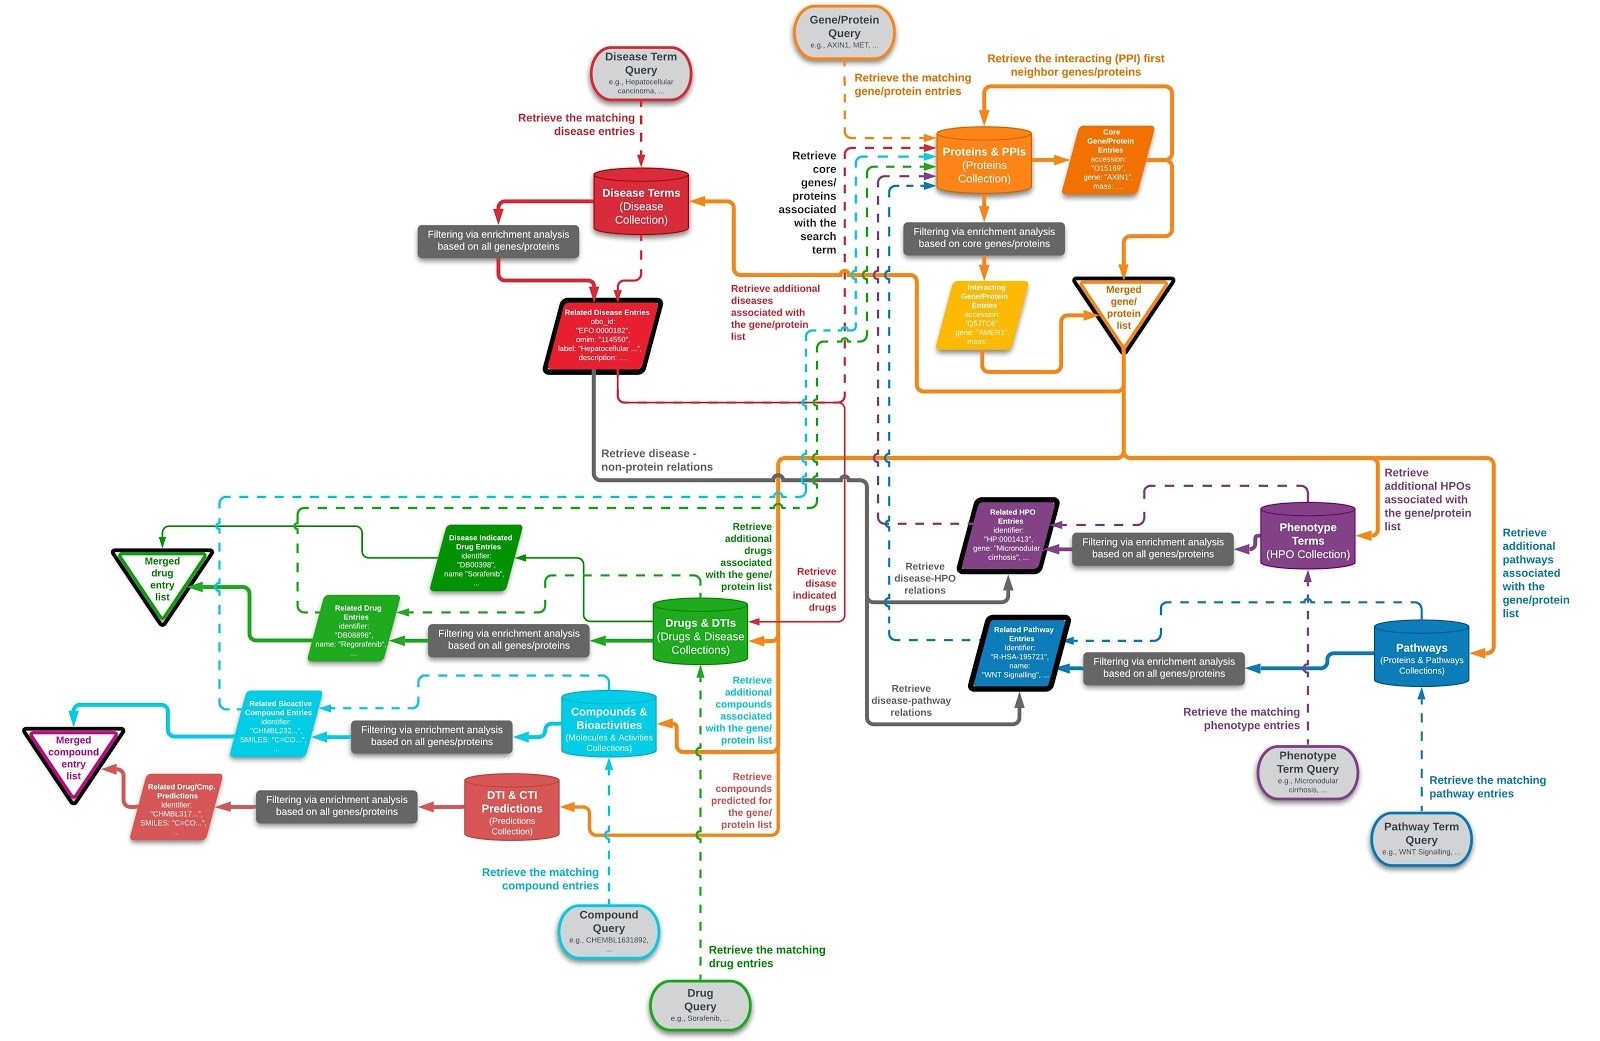
CROssBAR's user-query specific biomedical knowledge graphs are constructed on-the-fly, in real- time. The user query may include one or more genes/proteins, disease/phenotype terms, pathways/biological processes and/or drugs/compounds. The full-scale version of the knowledge graph construction pipeline is displayed in the diagram below.
During the construction of a knowledge graph, first, queried biological term’s connected gene/protein entries (i.e., core genes/proteins) are obtained, such as the member genes/proteins of the queried signalling pathway. After that, neighbouring/interacting genes/proteins (i.e., first neighbours) are added to the graph. This is followed by the addition of other biological entity types by querying the CROssBAR database with the total gene/protein list at hand (both core and neighbouring), to obtain disease terms, phenotypic terms, drugs, compounds and additional biological processes/pathways related to these genes/proteins.
At each step of the process, a hypergeometric test is applied to determine the biomedical terms that are overrepresented against the gene/protein list at hand, and to filter out the terms with low relevance to the graph. If the user starts a heterogenous search that contains multiple terms from different entity types, both core and neighbouring genes/proteins are independently collected for each non-protein query term, and the entity collection process is continued using the union of these genes/proteins. This approach enables the exploration of both direct and indirect relationships between queried terms.
Work-flow of the CROssBAR Knowledge Graph Construction Process
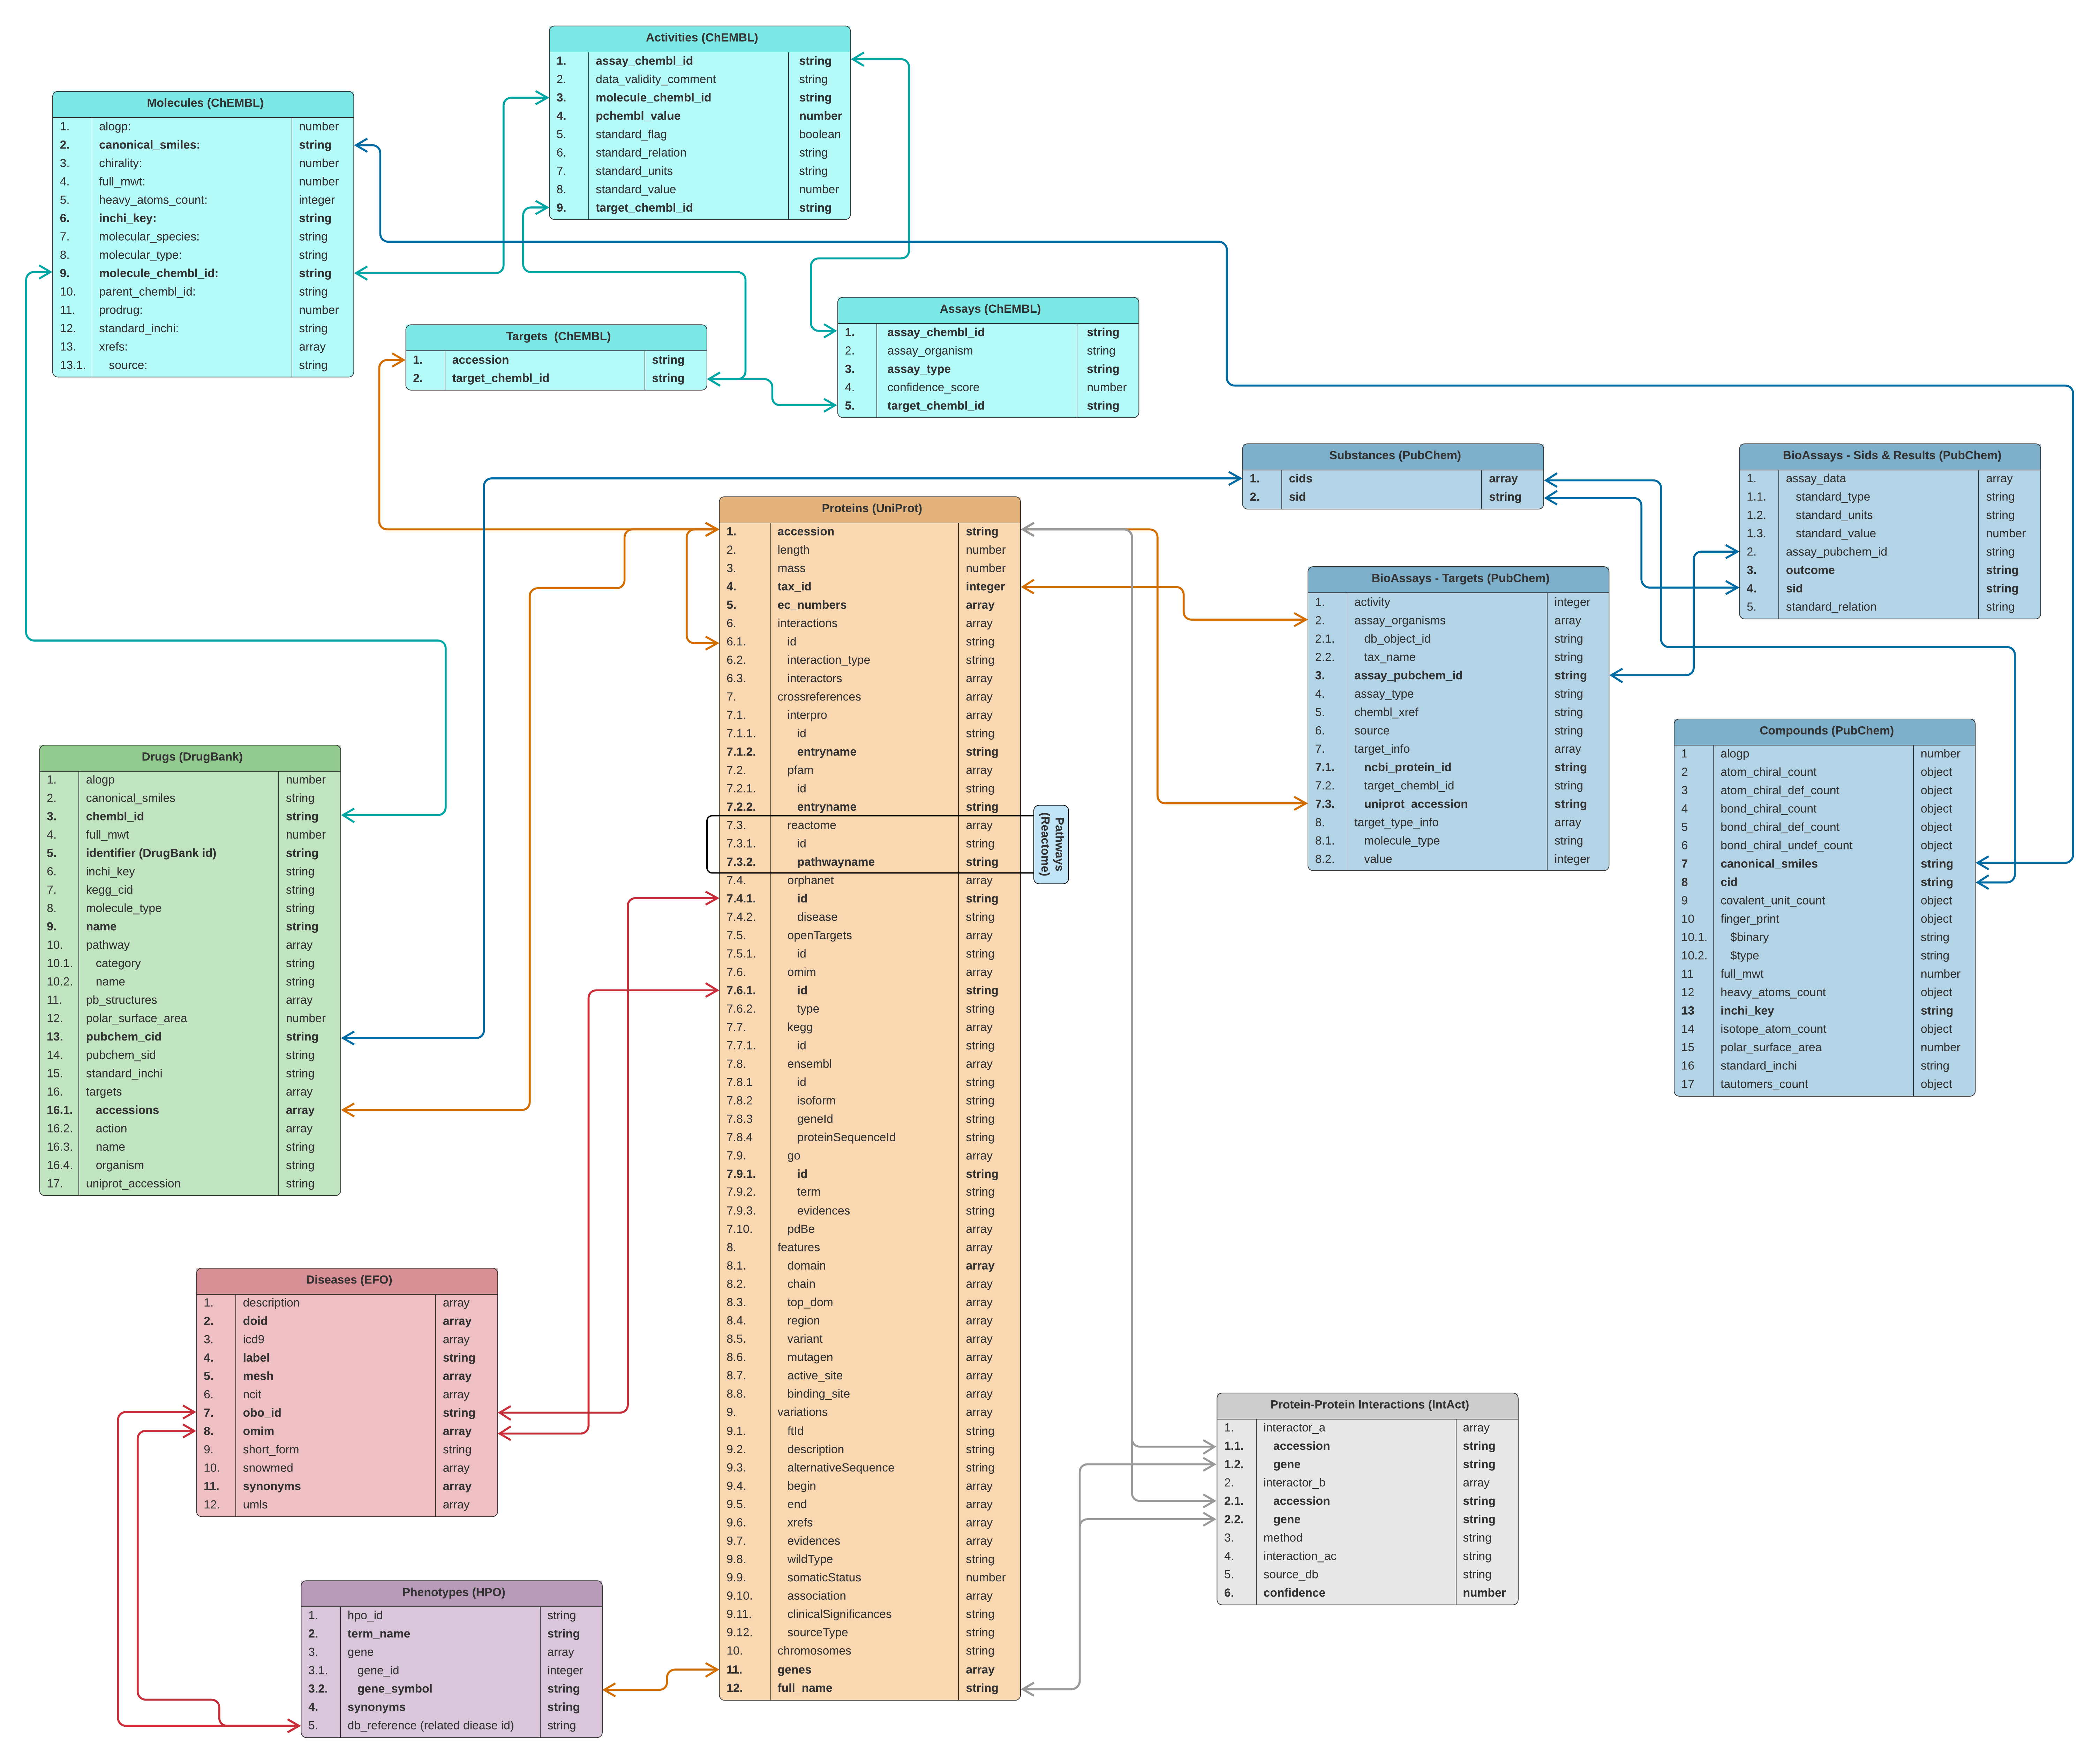
The data source for the CROssBAR knowledge graphs is the CROssBAR NoSQL database, which is housed at EMBL-EBI servers and communicated via a public RESTful API service at https://www.ebi.ac.uk/Tools/crossbar/swagger-ui.html. CROssBAR database comprises carefully selected features from various biomedical data sources namely UniProt, IntAct, InterPro, DrugBank, ChEMBL, PubChem, Reactome, KEGG, OMIM, Orphanet, Experimental Factor Ontology (EFO) and Human Phenotype Ontology (HPO), in MongoDB collections. CROssBAR database schema is provided below.
Schematic representation of the CROssBAR noSQL database